If you are considering bolstering your organic SEO efforts with some fast results PPC, Google is no longer the only game in town, and hasn’t been for a long time. For some businesses and brands Facebook advertising can reap excellent results, and often for a lower spend than Google Ads.

It’s fun when people finally have their ads up and running and have some Facebook ad stats to look at! As a result, it’s not uncommon to hear things like, “I ran my ads and reached a gazillion people and received 300,000 video views for $0.02 each!” Isn’t that great???? But, not long after, they’re back, and this time they’re not so happy. “Oh, no. I just got a few conversions, and they were all $10 each.”
Oh, no indeed.
This is one of the most vexing aspects of Facebook ads: they emphasize the statistics that will make you HAPPY (or at least optimistic) about your campaigns while concealing the ones that show you what happened to your hard-earned cash.
When we say “conceal,” we’re referring to the fact that they aren’t visible as soon as you open the Facebook Ads Manager. The critical metrics are easy to find if you know where to look.

Very quickly, before we start discussing the Facebook ad metrics that really do matter, let’s talk about the three that really don’t, but Facebook would like you to think they do:
The Three Facebook Ad Metrics You Can Basically Ignore

Reach
Unless you’re spending a lot of money on Facebook advertising every day, you don’t need to be too interested in your reach. What you really want to know is what percentage of those people react to your advertisements. And, as much as we hate to break it to you, the percentage will always be small in comparison to your theoretical reach.
So, if your Facebook ads have hit 120 people, and you’re wondering why no one has signed up for your webinar, it’s because 120 people is the Facebook ads equivalent of, well, NOBODY.
Clicks
Regardless of the type of ads you run, you’ll invariably receive a large number of irrelevant clicks. Yes, there is such a click, especially on the name of your website, the Like button, or the See More button if your ad copy is lengthy.
Since your goal is most likely to get people to your website, the vast majority of those clicks are meaningless. This is yet another instance of Facebook attempting to inflate your ego by providing irrelevant statistics. Do not pay attention to it.
Video Views

Okay, if you’re running Facebook video advertising, this measure is crucial. But, understandably, a view isn’t always a view. A view on Facebook is described as someone who watches your video for three seconds or longer.
Since videos in News Feeds often autoplay, someone’s passive non-watching might be counted as a view if they don’t scroll past it quickly enough. Continue reading to learn about other significant metrics to consider for Facebook video advertising.
The Facebook Ads Metrics That Do Really Matter
So, which Facebook Ad metrics really matter? The following sections explain each of the most important Facebook ad metrics, as well as how they work together to tell you what to do next with your Facebook ad campaign.
For Lead Generation Campaigns
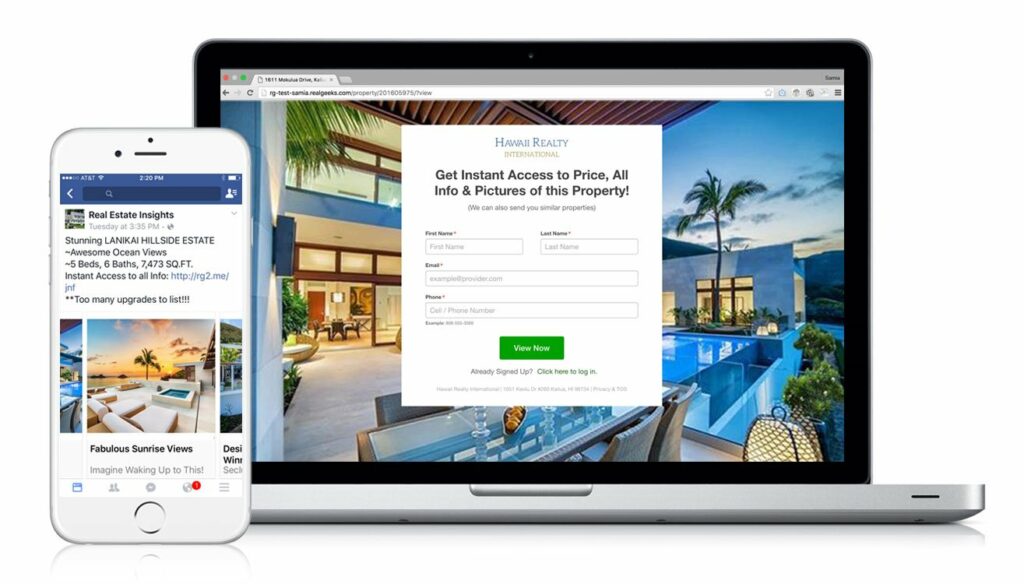
The following are the main metrics to monitor for any Facebook ad campaign that drives traffic to a sign-up page of any kind:
Impressions:
The cumulative number of times your ad was seen is known as impressions. This is different from Reach, which refers to the number of people who have seen your ad individually.
Average Cost per 1,000 impressions (CPM)
This is the cost of showing your ad 1,000 times. Consider this Facebook’s price tag for your ad; it varies depending on the demand for the audience you’re targeting at the time your ads are running.
Note that running the same ad on one day versus the next could be priced differently each day. You don’t have much influence over this, but you might find that some audiences consistently generate higher CPMs. It’s all about supply and demand, so make sure you’re always experimenting with new audiences.
Frequency
Frequency is the average number of times each person has seen your advertisement.
This is a vital metric to monitor to ensure that your advertisements do not oversaturate your target audience. For ads in the News Feed, you should keep your Frequency under four, and for ads in the Right Sidebar, you should keep it under eight.
Amount Spent
Obviously, this one matters even if it’s a very simple metric. In the Facebook Ad Manager dashboard amount spent refers to how much you’ve spent so far on your advertising You control this through the Budget portion of your ad sets.
Click-Through Rate
For lead gen campaigns this one is a biggie. Click-Through Rate aka CTR is the percentage of people who saw your ad and went to your opt-in page after clicking on it. The number of Link Clicks is divided by the number of Impressions to arrive at this figure.
Link Clinks
This is similar to the previous metric and just as important. This figure is the number of people who visited your opt-in page after clicking on your ad. This is a useful metric for estimating how many people visited your opt-in page.
CPC
Cost per Click (CPC) the average cost of a click through from your ad to your website The Amount Spent is calculated by dividing by the number of link clicks by amount spent to arrive at this figure.
Leads and Cost Per Lead
The number of people who signed up on your landing page after clicking on your Facebook ad is referred to as leads. The cost per lead is the amount you’ve spent so far on each sign-up. The Amount Spent is divided by the number of Leads to arrive at this figure.
What to Do With This Data
Your most significant metric is Cost Per Lead. If your leads are more costly than you’d like, use the following numbers to find out why:
To calculate the conversion rate of your landing page, divide link clicks by leads. If it’s less than 30%, there are a number of things you can do and try to raise it.
If your CTR Links numbers are poor (less than 1%), your ad creative isn’t engaging enough, or you’re targeting the wrong audience. Writing more compelling copy is a fantastic way to boost your CTR. Your words, and there aren’t many of them, need to be real attention grabbers.
Most Important Facebook Ad Metrics for Sales Campaigns
If you are running a Facebook Ads campaign specifically to generate product sales then many of the most important metrics to pay attention to are the same as we have just discussed. There are a few additional points of data to keep a close eye on though:
Impressions: This is the total number of times your Facebook ad was shown to users.
Cost Per 1,000 Impressions (CPM): the average cost to show your Facebook ad to people 1,000 times.
Frequency: the average number of times each user has been shown your ad.
Amount Spent: how much all this has cost you so far.
Click-through Rate (CTR) Links: the percentage of users who saw your Facebook ad who were then engaged enough to click over to your sales page.
Link Clicks: the number of users who clicked on your ad and were redirected to your sales page.
CPC (Link): the average cost of each click to your goal sales page directly from your Facebook Ad.
Checkouts: the number of people who became customers as a result of your ad. This necessitates the installation of conversion tracking on the “thank you” page that customers see after completing their order.
Cost per Checkout: how much each conversion has cost you, displayed on an average basis.
What to Do With This Data
Your first priority is to determine how many Checkouts you have and how much each one costs. Your Cost Per Checkout should be significantly lower than the actual price of your product.
Are you dissatisfied with your results? First and foremost, be aware that selling cold on Facebook is extremely difficult. So it may not work for you, but you’ll never know until you give it a shot.
If your CTR Links is poor (less than 1%), your ad creative isn’t engaging enough, or you’re targeting the wrong audience. You should try a different audience if your CPM is high.
Using Google Analytics, you should also look at the average sales conversion rate on your sales page. It’s possible that Facebook ad traffic isn’t interested in parting with their money directly via a random Facebook link – which is one of the big challenges of Facebook selling – but warmer traffic from your blog or social media is more likely to do so. Try using a retargeting technique to display Facebook ads to past site visitors if this is the case. To figure out the data of these analytics more precisely you can use Facebook insights tools available in the market.
Most Important Facebook Metrics For Facebook Video Ads
If you are running a Facebook Ads campaign specifically to generate product sales then many of the most important metrics to pay attention to are the same as we have just discussed. There are a few additional points of data to keep a close eye on though:
Impressions: This is the total number of times your Facebook ad was shown to users.
Cost Per 1,000 Impressions (CPM): the average cost to show your Facebook ad to people 1,000 times.
Frequency: the average number of times each user has been shown your ad.
Amount Spent: how much all this has cost you so far.
Click-through Rate (CTR) Links: the percentage of users who saw your Facebook ad who were then engaged enough to click over to your sales page.
Link Clicks: the number of users who clicked on your ad and were redirected to your sales page.
CPC (Link): the average cost of each click to your goal sales page directly from your Facebook Ad.
Checkouts: the number of people who became customers as a result of your ad. This necessitates the installation of conversion tracking on the “thank you” page that customers see after completing their order.
Cost per Checkout: how much each conversion has cost you, displayed on an average basis.
What to Do With This Data
Your first priority is to determine how many Checkouts you have and how much each one costs. Your Cost Per Checkout should be significantly lower than the actual price of your product.
Are you dissatisfied with your results? First and foremost, be aware that selling cold on Facebook is extremely difficult. So it may not work for you, but you’ll never know until you give it a shot.
If your CTR Links is poor (less than 1%), your ad creative isn’t engaging enough, or you’re targeting the wrong audience. You should try a different audience if your CPM is high.
Using Google Analytics, you should also look at the average sales conversion rate on your sales page. It’s possible that Facebook ad traffic isn’t interested in parting with their money directly via a random Facebook link – which is one of the big challenges of Facebook selling – but warmer traffic from your blog or social media is more likely to do so. Try using a retargeting technique to display Facebook ads to past site visitors if this is the case.
Most Important Facebook Metrics For Facebook Video Ads

This is where we tell you about the metrics that really do matter if you are running Facebook videos ads, as promised earlier. Facebook video ads are more expensive on the whole, so gleaning as much as you can from the data on offer to make every penny you spend count is a must. Specifically, keep an eye on all the following:
Frequency: the average number of times each individual has seen your ad.
Amount Spent: how much it’s cost you to keep running your Facebook video ads so far.
Thruplay: the total number of times your video has been viewed for at least 15 seconds. This is more useful information than simple video views, but it’s still not as good as a stand-alone metric.
Average Percentage of Video Viewed: how much of your video was actually seen by those who “viewed” it.
Views to 75% : what percentage of people who “viewed” your video actually watched it all the way through to the 75% mark (which is almost as good as seeing it all the way through)
Also, once again, you should monitor link clicks, CPC, leads and cost per lead.
What to Do With This Data
Video advertisements have worked wonders for some people in terms of driving traffic to an opt-in website and converting visitors. The majority of users, on the other hand, have received a large number of views but few clicks to their website.
The good news is that Facebook will provide you with a list of people who have “viewed” your ad. You can retarget those people with other advertising, such as daily link ads, to promote your free content or product.
In terms of how you can improve your Facebook video ads in general if your video’s average percent of video views is poor, the beginning of the video might not be enticing enough to capture and keep people’s attention. A specialised Facebook ad designer, for example, could help you create eye-catching, clickable content within the first few seconds. It’s also possible that your video is just too long; even the most devoted audience can only watch for so long.
Also pay serious attention to that cost per lead figure. Continue to run this video ad if it’s less expensive than your average cost per lead for non-video campaigns. Don’t be discouraged if the lead costs are increasing. If you retarget those people with unique advertising for something they can’t say no to, those video views might work in your favor. After all, they’ve already begun the process of getting to know you if they’ve watched your video, even if just a portion of it.
Need help with your PPC ad campaigns, Facebook, Google or other? Contact Pearl Lemon today to discuss how we can help.


