No matter how strong the content on your website might be, sometimes, we underestimate the power of strategic planning. The strategic planning of your content can either break or make your website.
But how do you recognise these hotspots across your website? How do you understand where your audience spends most and least of their time? Moreover, how to manipulate this to your advantage?
Website heatmapping is the solution to overcoming most of the setbacks on your website, allowing you to optimize them to higher conversion rates and improved guest experience.
Website heatmaps are an effective way to understand how the audience interacts with your website – most popular sections on the website, least visited links and overall user behaviour.
The following guide aims to introduce to you the different industry applications of heatmaps, primarily website heatmaps, how to create and analyse them to profitably grow and boost your website.
What is a Heatmap?
A heatmap is a form of graphical visualisation of data here the values are represented by different colours. The colours on the heat map denote the frequency of events such as performances of matrices in a data set. This form of data representation eliminates the complications of reading numbers and presents data in a simple yet comprehensive way:

Photo credits: Hotjar
Both sets of data are similar, but surely the heat mapped image on the right is much easier to understand
The History of Heatmaps:
Heat maps have been around since around the 19th Century and have constantly evolved. They first originated as a manual 2D gray-scale matrix, where black or dark grey blocks would represent high values or frequencies, while the lighter shades represented small values or frequencies. The first known use of a heatmap was by Loua in 1873 for depicting various social statistics of Paris using colours.

Photo credit: Google
Heatmaps Across Industries:
Heatmaps are used across industries with the common aim of visually representing data, which benefit them in unique ways.
Stock Index Heatmap
Heatmaps in the financial markets are beneficial for the identification of recent trends from the preceding ones. They allow investors and speculators to be profitable by identifying the stock options, which are bullish or bearish in nature, as shown below:
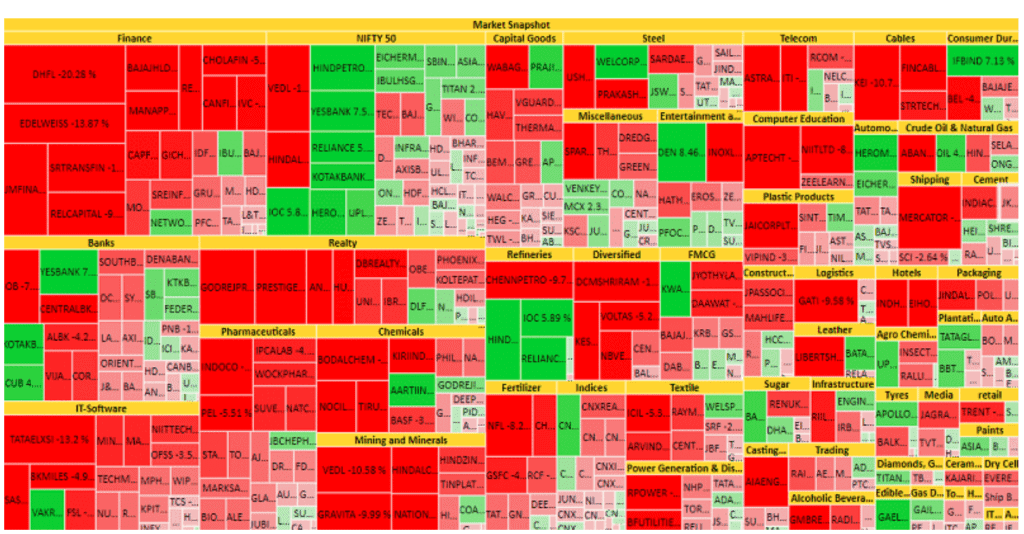
Image credits: VWO Blog
Geographical Heatmap
Geographical heatmaps allow us to identify the density of a specific parameter such as population density through a system of colour-coding. These geo heatmaps greatly benefit the travel and business industry to monitor the real-time movement of people which translates to them in different ways.
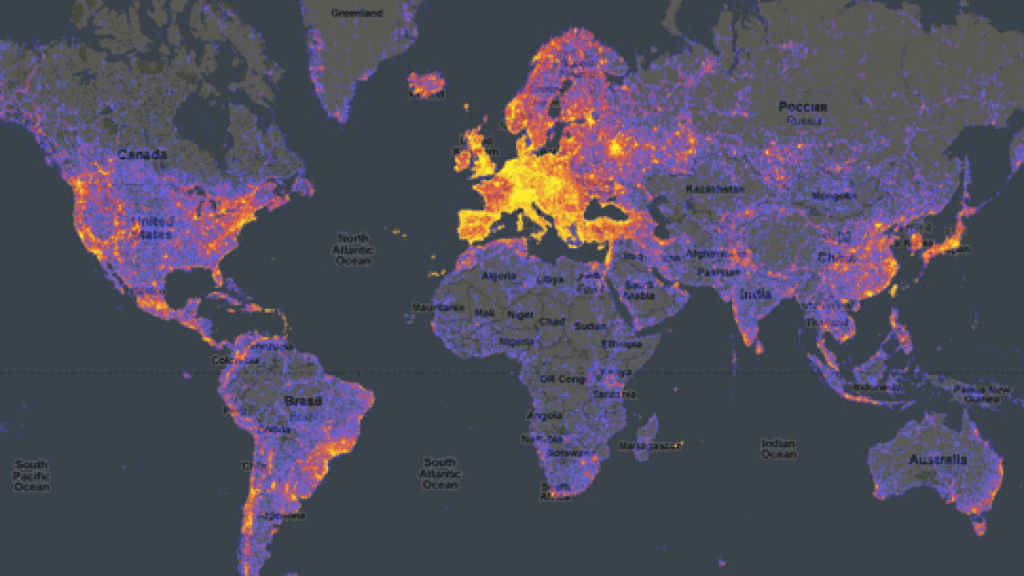
Photo credit: Google
Sport Heatmap:
The most recent and creative employment of heatmaps has been in sports where heatmaps of players can be plotted to monitor on-field performances. These allow coaches and managers to identify areas of improvement, discover the opponent’s game plan or even develop strategies to overcome them.
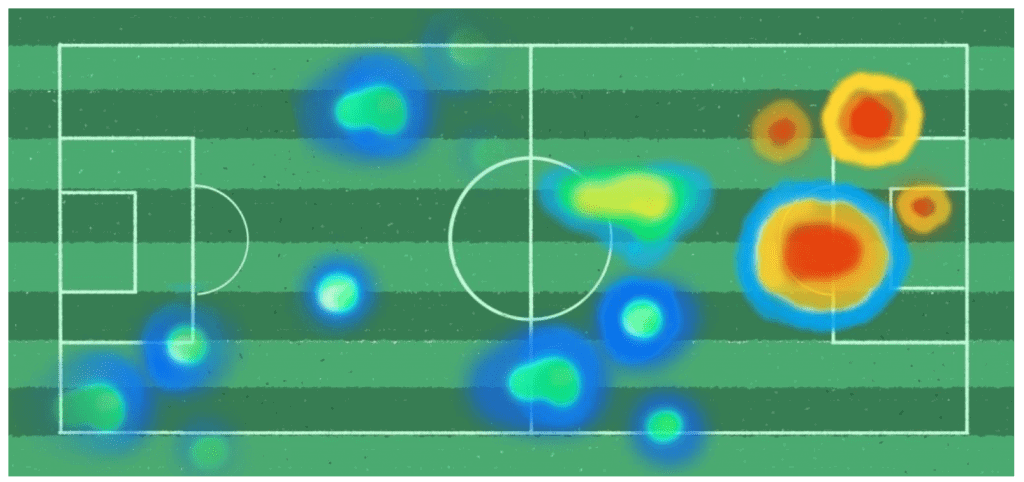
Photo credit: VMO Blog
Website Heatmap
Website heatmap represents the hot (popular) and cold (unpopular) sections of the page to understand the extent of user interaction such.
With a mix of warm and cool colour tones, where warm colours represent high engagement, and cold colors represent low engagement, heat maps aggregate user behavior and allow you to optimise the website more profitably.
Website heatmaps are critically important for e-commerce companies whose main revenue stream comes from the internet. Heatmaps in such cases help us by providing comprehensive insights by analysing the most popular and unpopular elements on the website, which can be optimised to drive more traffic and positively lead to high conversion rates.
Types of Website Heatmap
Heatmap is an umbrella term for the 4 types of heat mapping tools, namely:
- Clickmap
- Scrollmap
- Mouse Tracking Heatmap
- Eye Tracking Heatmap
Clickmap
In addition to identifying the popular (through warm tones) and unpopular (through cold tones) sections of your website, clickmap spots navigational gaps on our webpage. Click maps allow website users to monitor user engagement involving clicks on buttons, links, images, through mouse-clicks or fingers (in which case it’s called touch heatmaps), optimization of which leads to better conversion rates.

Photo credits: Tatvic
Click maps allow the website owner to improve user experiences through creating a better web design, improving conversions, spot underperforming CTA and fixing bugs. This tool displays the click popularity through the red to blue colour tones in addition to the total number of user clicks and user click percentage.
Scrollmap
The scrollmap tool aggregates scrolling behaviour of the users; it shows how far down the audience scrolls and which sections they spend most of their time on. Therefore, it is recommended that the most critical elements of your website should be placed in sections where user engagement is the highest.

Photo credit: Hotjar
Scroll maps don’t simply depict user activity on your website through the warm-blue color tone but complement it with percentages, allowing you to determine an ideal length. Moreover, it helps you recognize the most popular sections of your website, which can be optimised by placing CTAs.
Mouse Tracking Heatmap
The Mouse Tracking Heatmap (or Hover Maps, Move Maps, Attention Maps) aggregates user activity engaged in hovering the cursor across your website. Therefore it heatmaps the sections on your website where users hover their cursors most frequently, and infrequently.
This feature allows you to detect where the users hang around the most and enable you to optimise this information by placing important content, CTAs and necessary advertisements.
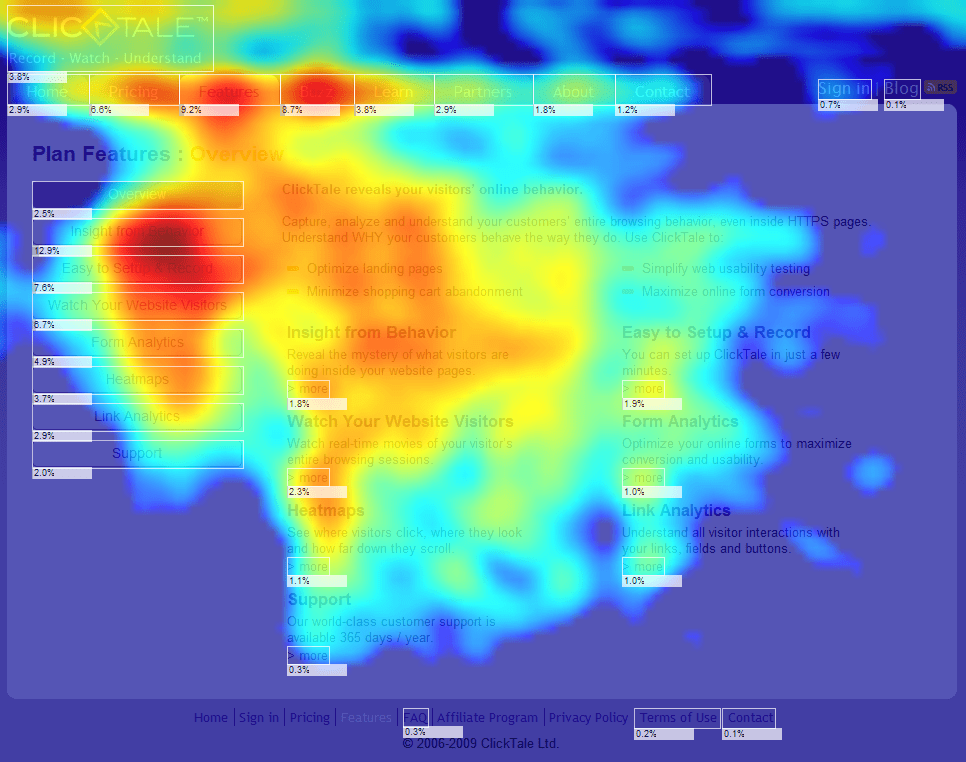
Photo credit: Clicktale
Additionally, mouse tracking heatmaps allow you to identify sections on your website, which might not be very user friendly– as the language of the content might be too difficult to understand or confusing.
However, it must be noted that the above may not always be true since users often keep their cursor parked randomly across your website while reading your content. Therefore, to avoid data pollution, it’s recommended to provide your users with a buffer time of a few minutes to identify instances where the content on your website might be confusing or difficult to understand.
Eye Tracking Heatmaps
Eye-tracking heat maps although very similar to mouse tracking heatmap, differ in significant ways- primarily by the fact that unlike studying user cursor activity, this tool track’s user eyeballs by monitoring the frequency of viewing the same image.
E-commerce websites are likely to benefit from the eye-tracking tool as a simple manipulation of elements across the website to sections popularly viewed would optimize it profitably since it’s likely to match visitor expectations.
Predictive eye tracking heatmap is an AI-based alternative to eye tracking heatmap. It relies on pre-collected eye tracking data to simulate human vision.
Heatmaps, generated by AI, just like eye tracking heatmaps, show which areas of the visual materials people are likely to view the most and the least.
Predictive eye tracking is a way cheaper option that allows marketers to make fast data-driven choices. It allows you to analyze any website of your choice in just a minute, even if it doesn’t have any traffic.
Benefits of Website Heatmap
Website heatmaps, as we have mentioned before, allow you to draw valuable inferences on user activity on your website. However, in addition to that, there are many more significant advantages and benefits of website heat mapping, such as:
1. Providing you with an instant overview of key online performance against varied parameters
Heatmaps analytics draw instant attention to issues your website is facing. Using different heatmapping tools such as clickmap, you can almost instantaneously discover areas on your website which need attention. Through the color mix of warm and blue tones, you can identify key website areas that are performing well against those that are not.
2. Easy to learn from user activity allowing high optimisation for a smarter web design
Heatmaps make it very convenient for web designers to learn from user activity on your website and make valuable tweaks to ensure higher conversion rates. A simple mix of colours help you determine what your audience click on, view and even ignore.
This information allows you to profitably move around crucial content across your website to the hotspots areas for greater optimisation and improves user experience.
3. Predict and improve the visitor experience
An aggregation of user experience across your website gives you very important bits of information such as what your audience is looking for when they visit your website.
For example, if you are an e-eCommerce website and have noticed a particular product being wildly popular among your customers, you can strategically advertise or link customers to the purchase option for this product on the warm zones on your website.
4. Simplifying numeric data through visualisation
The greatest appeal of website heat mapping is the ease of analysing data visually and eliminating the cumbersome task of drawing inferences from heaps of numbers and proving data in an easy-to-understand manner.
Free Website Heatmap Softwares
A number of heatmap software are available for your use to optimise your website and online presence for conversion rates, and improved customer satisfaction.
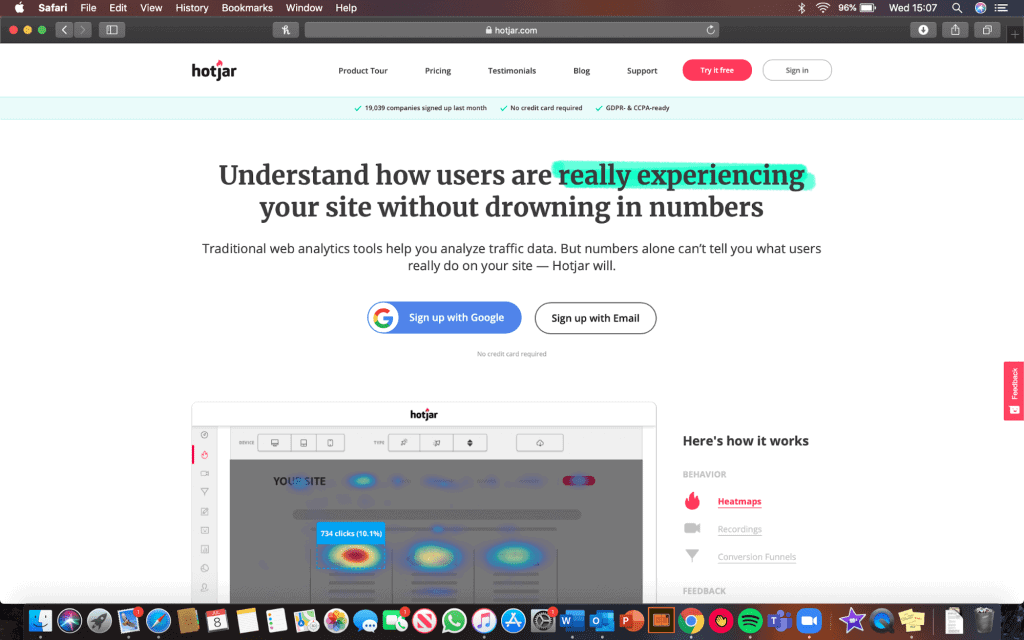
Hotjar
Hotjar provides a powerful solution for you to overcome many of the setbacks that are keeping you from eliminating potential hurdles through:
- Visualisation of data through website heatmapping
- Eliminating guest experience by providing visitor recording
- Improving your website by identifying out the page where your audience quits your site
- Form analysis which allows you to discover which fields take too long to fill, which are left blank, and why your visitors abandon your form and page.
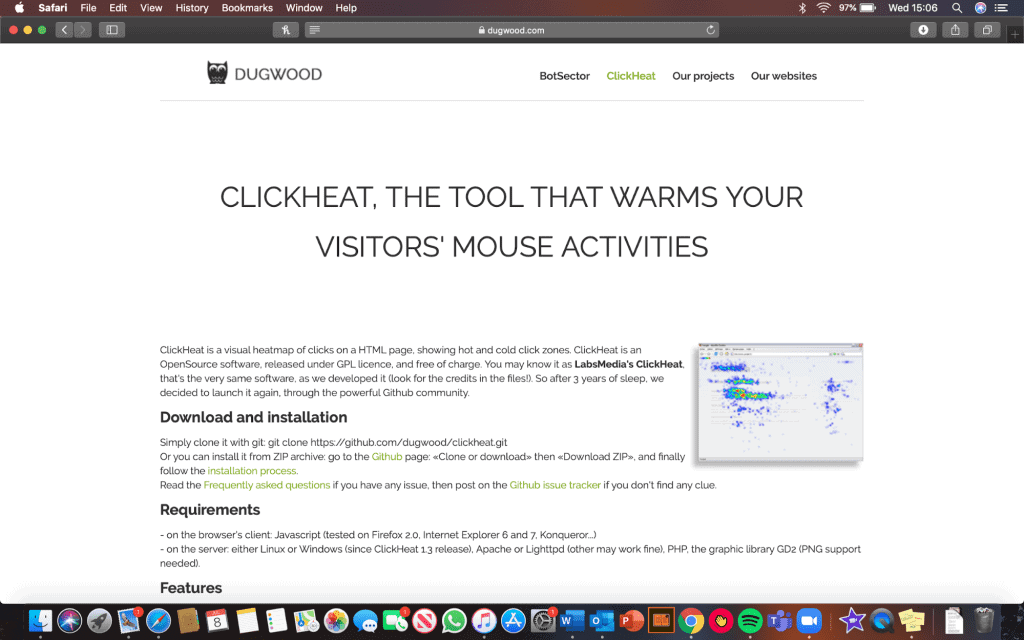
Clickheat
An open-source click heat mapping tool, Clickheat represents the hot and cold areas of your website based on user interaction of each webpage of your website. The sole prerequisite of using the tools is to clone the code (available on GitHub) or download it from ZIP archive.
VWO
VWO offers website heatmaps in addition to other UX capabilities.
It monitors static and dynamic user behaviour and creates heatmaps for you to analyse user activity on your website.
VWO offers a 30-day free trial period giving you the opportunity to judge and determine if the application suits your needs and requirements.
How to set up Website Heatmaps?
Website heat mapping allows you to develop or even validate some of your hypotheses about your website, which you wish to work on. The following information will provide you with in-depth knowledge about equipping website heat mapping tools to your advantage.
- Setting a goal: Every website has a purpose and an end goal it aims to achieve. In light of this, heatmaps come handy since they provide analysis and determine areas which need attention.
Therefore, before using a website heatmap tool, it is essential to remember the goal of your website and use inferences gathered from the tool to eliminate the potential setbacks that are keeping you from achieving the same.
- Choosing a heatmap tool that suits your needs: There is a plethora of software that are available on the internet for your use. The key, however, is to use the one that is tailored to suit your website’s needs the best.
- Setting up: Finalising the webpages on your website that need some tweaks for optimisation and for the heatmap to be plotted on. It is important to note that plotting heatmaps across your website is not recommended since you’re very likely to be bombarded with data you don’t require.
The following table represents the recommended heat mapping tools that are effective in acquiring certain goals:
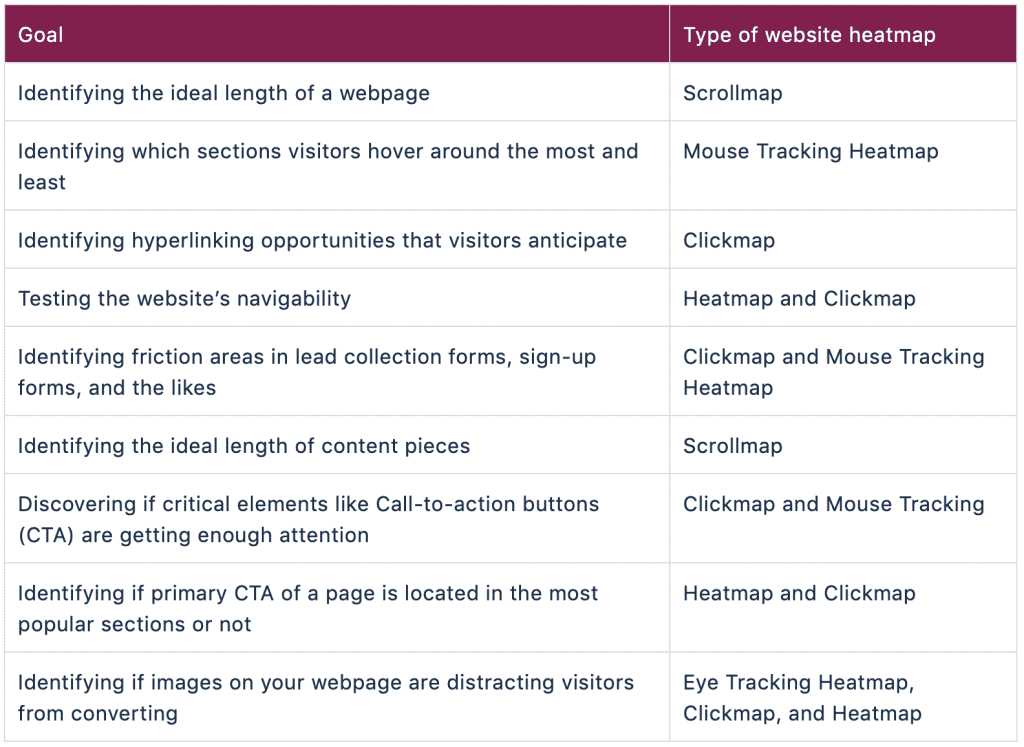
Photo credits: VWO
- Analysing the data: The last step is to manipulate the data to your advantage and ultimately optimizing your website. Using the gathered data, you can now strategically alter contents across your website to generate higher conversion rates.
As this comprehensive guide to website heatmaps comes to an end, we hope we achieved what we sought to do- provide you with a holistic idea of heat mapping, how to employ it, analyses results gathered from using the tool and finally identifying effects of heat mapping in the optimisation of your website.
More importantly, if you’re looking to get personalised advice from industry experts to better interpret your heatmaps, book a call with the Pearl Lemon Convert team today to discuss your specific needs!

